Prometheus is an open source monitoring and alerting tool that was the second addition to the Cloud Native Computing Foundation – following closely on the heels of Kubernetes itself. It can be used to monitor a variety of software deployments, but it is best known for how well it plays with Kubernetes itself. In fact, it can be deployed very easily into a K8s cluster along with an accompanying dashboard user interface (UI) called Grafana as a pre-baked Helm package to give users easy to read and incredibly granular information about the health of a given Kubernetes cluster.
Prometheus works by collecting time-series-data that it “scrapes” from specific endpoints defined within your cluster, which means that each datapoint it deals with is collected by querying a given endpoint time and again at an interval that is user defined. This allows for the tracking of all sorts of datapoints – such as CPU utilization and the amount of time spent handling a given process – over the full lifetime of your cluster, which allows you to see any changes to the health of your cluster and the software running in it.
Today, we’ll deploy Prometheus and Grafana on macOS running in a local cluster via Minikube. If you aren’t familiar with Minikube, and you’d like to learn more about it, check out this blog post on the topic.
Prometheus architecture
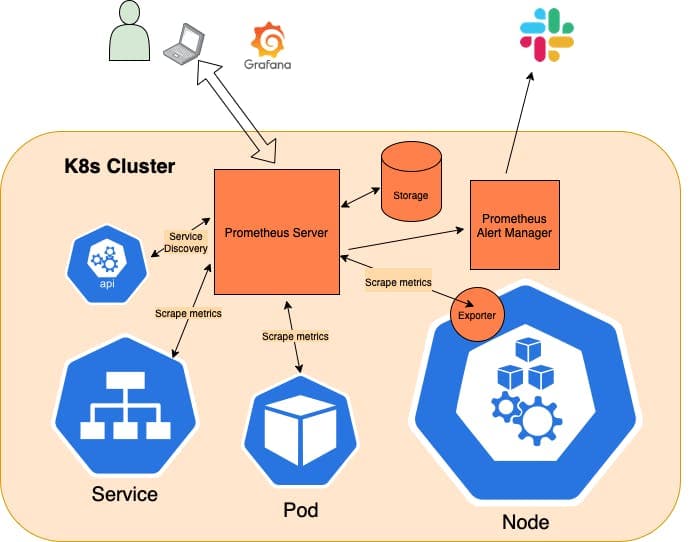
Key points:
- The Prometheus server talks to the K8s API in order to learn about services or standalone pods that it needs to scrape metrics from.
- There is also the concept of an exporter, which acts as a sort of sidecar for Nodes, 3rd party software, and custom software that collects and hands off metrics from these sources to the Prometheus server by providing an endpoint that Prometheus can scrape.
- Prometheus can store data locally via a custom, highly efficient, on-disk storage option or it can be paired with a 3rd party, cloud storage option.
- Prometheus also ships with an alert manager, which relays user-defined alerts (such as “X” percentage of CPU utilization being met) to tools like Slack or Pager Duty, so support staff can respond quickly when things go awry.
- Grafana acts as a UI layer on top of Prometheus, which makes visualizing the data being reported much easier and more pleasant.
Prerequisites for exploring Prometheus on macOS:
In order to run K8s and Prometheus locally on a Mac, we’ll install Minikube. To do so, you’ll need a driver installed, which can either take the form of a hypervisor that supports lightweight VMs, such as VirtualBox, or you can use Docker and run the whole thing in a container, which is what we’ll be doing today.
- Install Homebrew
- Install Docker Desktop
Minikube for local K8s testing and development
Installing Minikube on macOS is simple. Just install using Homebrew, like so:
brew install minikube
Once you have it installed, you can spin up a local, single-node cluster and get access to a UI dashboard (if you’d prefer that to stock kubectl commands) with the following pair of commands:
minikube start
minikube dashboard

Helm packages
With the above in place, we can move on to deploying Prometheus and Grafana to our new cluster. To do so, we’ll be using Helm to install a conveniently packaged artifact that includes both of these tools. But first, we’ll need to install Helm itself, like so:
brew install helm
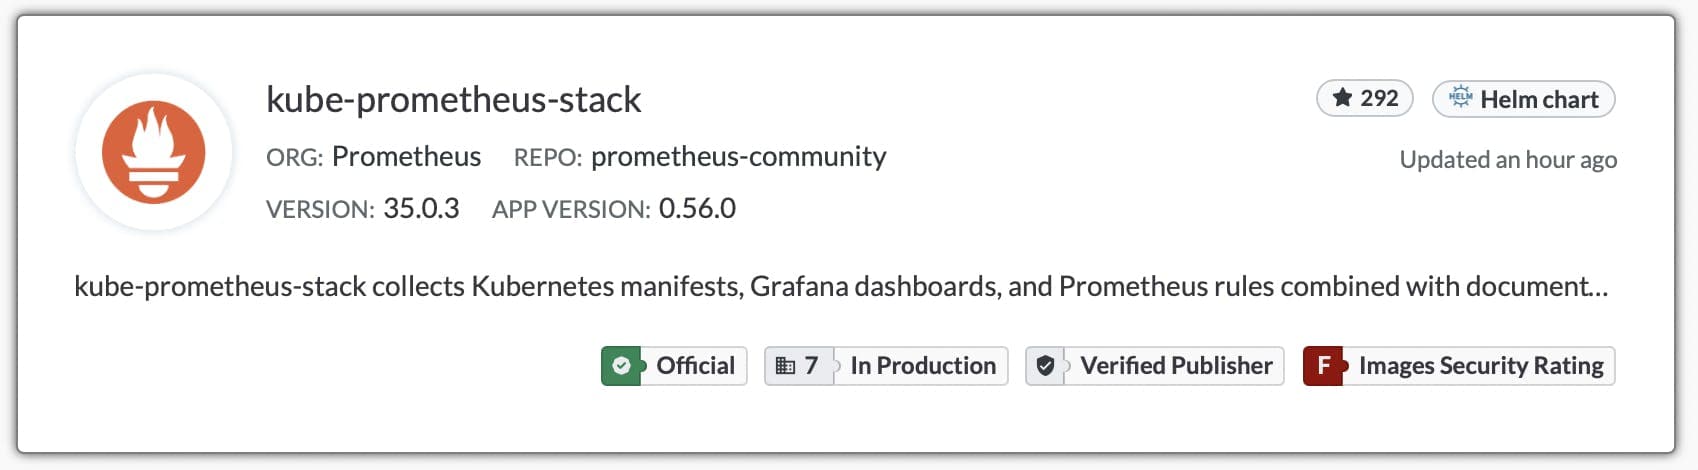
Once Helm is installed, we can add the targeted repository – kube-prometheus-stack – to our Helm instance with the following command:
helm repo add prometheus-community https://prometheus-community.github.io/helm-charts
Then, we can deploy it to our local Minikube cluster, like so:
helm install my-kube-prometheus-stack prometheus-community/kube-prometheus-stack - version 34.10.0
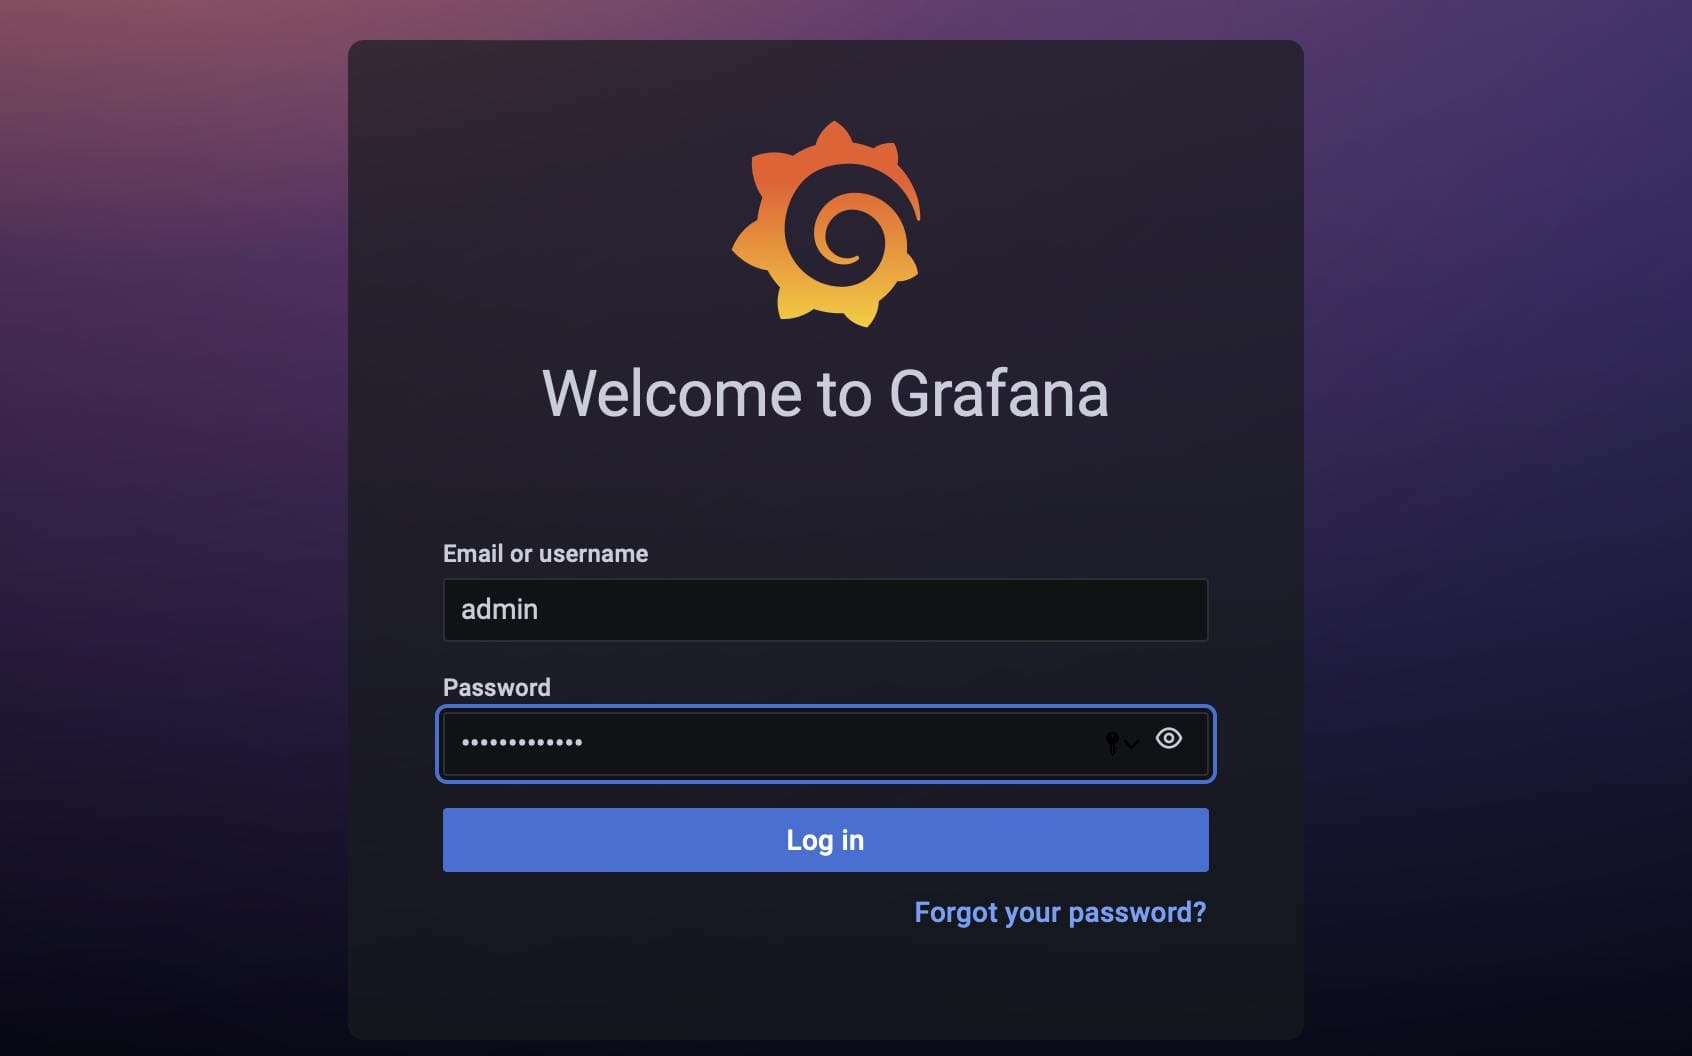
Once all the various pieces are spun up, we can retrieve our login credentials for Grafana with the following command:
kubectl get secret my-kube-prometheus-stack-grafana -o jsonpath="{.data.admin-password}" | base64 --decode ; echo
Accessing the dashboards
With our credentials in hand, we can move on to viewing the Prometheus and Grafana dashboards as follows:
kubectl port-forward svc/my-kube-prometheus-stack-grafana :80
Forwarding from 127.0.0.1:49375 -> 3000
Forwarding from [::1]:49375 -> 3000
NOTE: Allowing K8s to dynamically provision a port performs more reliably than setting it yourself explicitly. Once you’ve run the above, you can view the dashboard in the browser by navigating to the localhost address provided – i.e. 127.0.0.1:49375 in this specific example.
Next, we can expose the Prometheus dashboard in the same way with the following command:
kubectl port-forward svc/my-kube-prometheus-stack-prometheus 9090
Forwarding from 127.0.0.1:9090 -> 9090
Forwarding from [::1]:9090 -> 9090
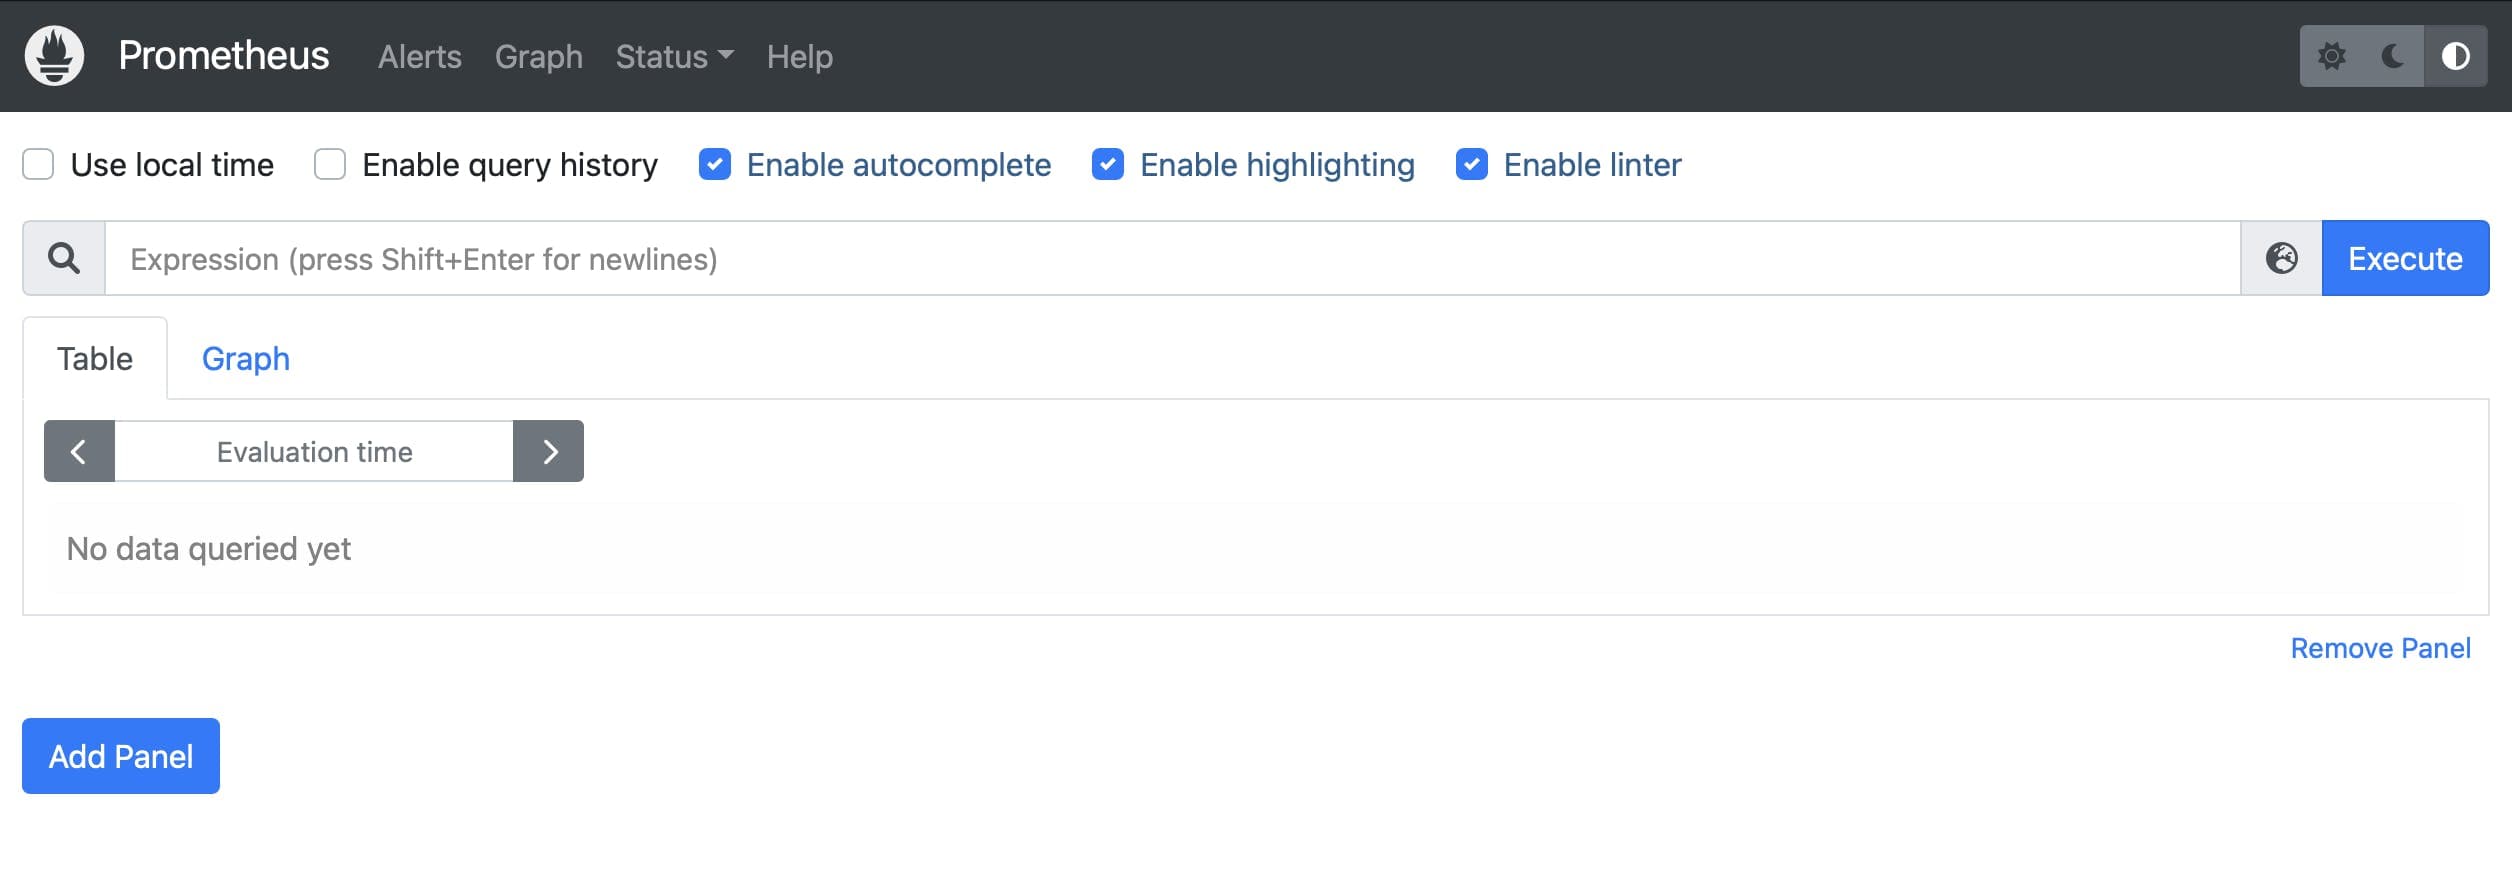
Defining queries with PromQL
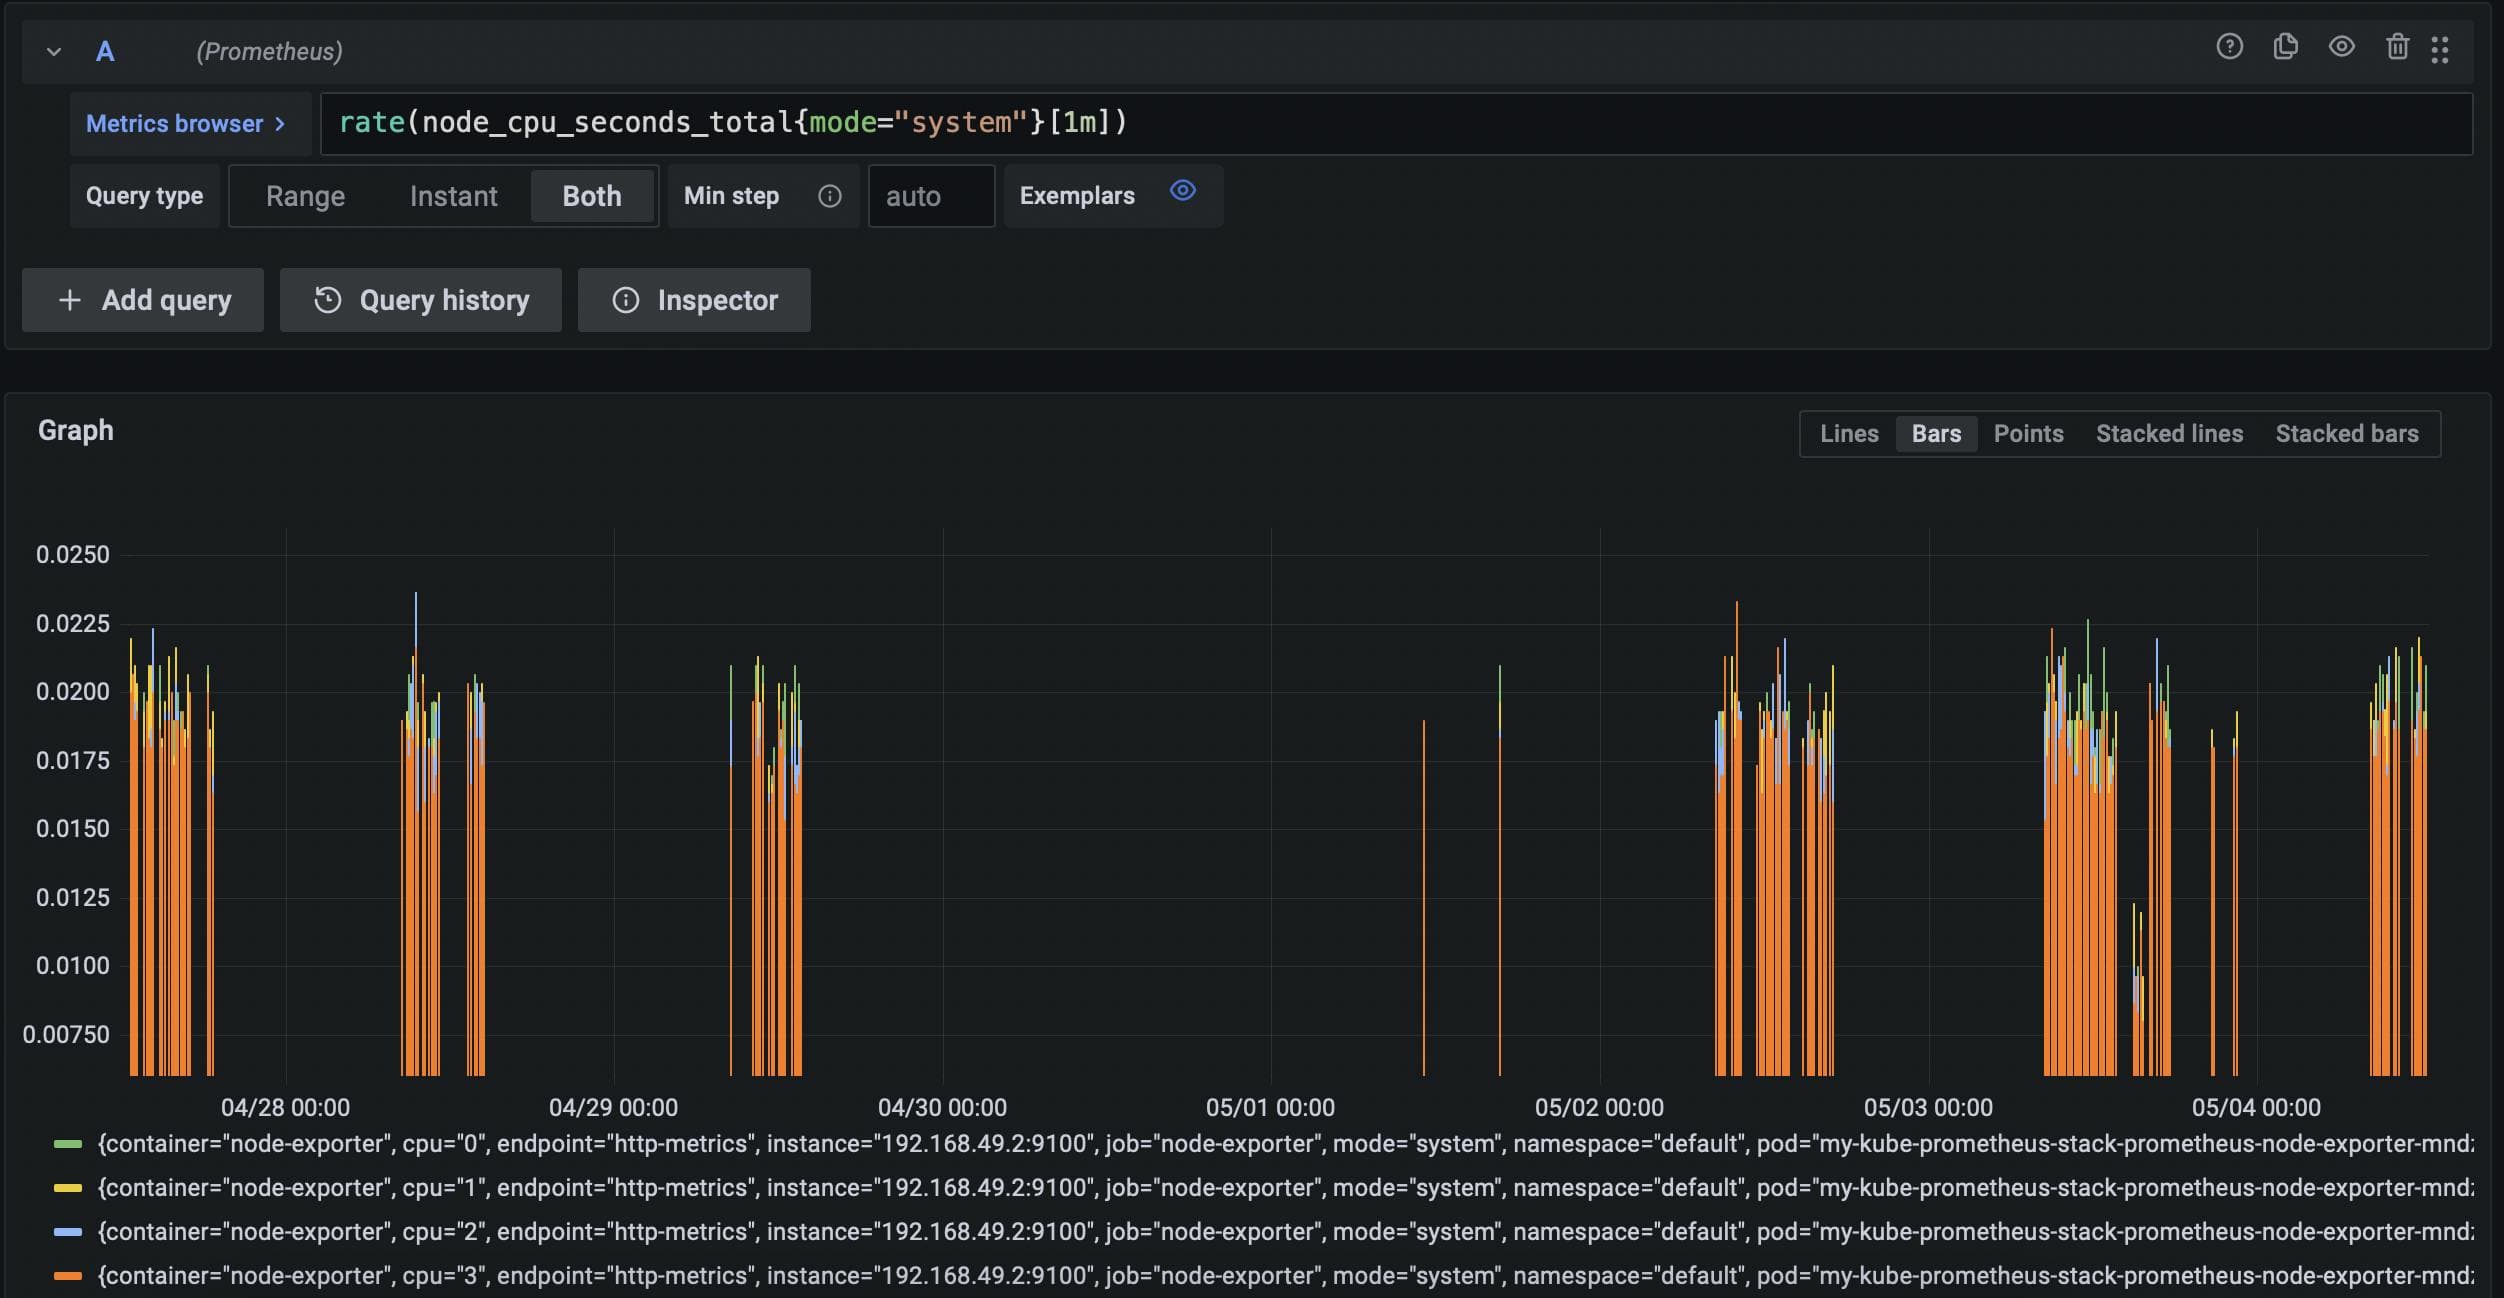
In order to request specific data from Prometheus, you’ll need to query the Prometheus server with the Prometheus Query Language (PromQL). The Prometheus docs offer a great stepping off point for getting started with PromQL, and they also have some very handy examples to get you started.
You’ll find that both the Prometheus UI and Grafana autocomplete search terms for you, so to get started you might enter node_ in the search bar to see all metrics being scraped from the Node exporter that ships with our Helm package.
Visualizing Prometheus data with Grafana
Once you’ve logged in (as shown above) you’ll be able to submit PromQL queries via the search bar available in the Discovery tab shown in the sidebar. You will also be able to combine related data into logically organized dashboards via the Create > Dashboard tab available in the same sidebar.
TL;DR
Prometheus is an extremely powerful monitoring tool for Kubernetes clusters and the software running therein. It works by scraping data from endpoints within your cluster at regular intervals over time, so that all manner of changes can be identified in real time, which allows you respond to any problems with your cluster quickly and efficiently. Above, we have covered the steps to explore these tools via a single-node, Minikube cluster running locally on macOS.